
Salesforce is a powerful, low-maintenance Customer Relationship Management (CRM) system with a user-friendly interface and easy customization. It’s the platform of choice for digitizing the front office experience. Yet capturing your data in Salesforce is only half the job. For the other half, you’ll need to generate reports and analyze the data. Many organizations don’t fully leverage the powerful Salesforce reports and dashboards.
A Salesforce dashboard is a combination of information streams, each made up of a single report. These dashboards are very useful when you or your stakeholders need a visual representation of your data. Salesforce dashboards also help you compare and interpret your data. You can use them to track metrics and your organization’s performance in real-time.
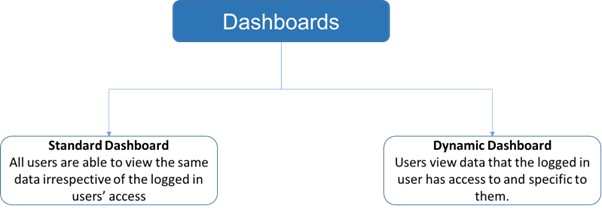
Salesforce dashboards are powerful visual tools used to track metrics, analyze trends, and monitor business performance. However, not all dashboards are created equal. One key distinction in Salesforce is between Dynamic Dashboards and Static Dashboards. Understanding their differences, use cases, and governance is essential for maximizing the value of your Salesforce implementation.
What Are Static Dashboards?
Static dashboards display data based on a fixed set of criteria defined during creation. They do not change based on who views them unless manually updated. A Static Dashboard runs using the data visibility of a specific user, defined in the dashboard settings.
Key Characteristics:
-
-
Fixed Data Scope: Shows the same data to all users.
-
Manual Updates Required: Needs refreshing if underlying data changes.
-
Simpler to Create: No need for complex filters or security settings.
-
Use Cases for Static Dashboards:
-
-
Executive Reporting: High-level KPIs that remain consistent across the organization.
-
Compliance & Audits: Historical data snapshots that should not change.
-
Department-wide Metrics: Standardized performance tracking (e.g., monthly sales targets).
- Useful for shared team views or executive summaries.
-
Example:
-
- A Sales Director wants to see pipeline metrics across all regions.
- Set the running user as the Director, and all team members view the dashboard from that perspective.
- A CEO dashboard showing quarterly revenue, customer acquisition costs, and regional sales—visible to all executives in the same way.
What Are Dynamic Dashboards?
Dynamic dashboards adjust their data based on the viewer’s permissions and role. They provide personalized insights without requiring multiple versions of the same dashboard.
Key Characteristics:
-
-
Role-Based Data Filtering: Automatically displays data relevant to the user.
-
Real-Time Personalization: Changes based on who is viewing it.
-
Reduces Dashboard Clutter: Eliminates the need for duplicate dashboards.
- Each user sees only the data they are allowed to see
- No need to clone dashboards per user or team
-
Use Cases for Dynamic Dashboards:
-
-
Sales Teams: Each rep sees only their own opportunities and pipeline.
-
Support Teams: Agents view cases assigned to them or their queue.
-
Regional Managers: Data filtered by territory automatically.
-
Example:
-
- A sales dashboard where a rep in the “West Coast” region only sees their deals, while a rep in the “East Coast” sees theirs—all from the same dashboard.
- The same dashboard auto-adjusts based on who is viewing it.
Key Differences: Static vs. Dynamic Dashboards
| Feature | Static Dashboards | Dynamic Dashboards |
|---|---|---|
| Data Scope | Fixed for all users | Changes based on viewer |
| Personalization | None | Role-based filtering |
| Maintenance | Manual updates needed | Automatic adjustments |
| Complexity | Simpler to set up | Requires security setup |
| Best For | Standardized reporting | Personalized insights |
When to Choose Static vs. Dynamic Dashboards?
-
-
Choose Static If:
-
You need consistent reporting for all users.
-
Data does not change frequently.
-
Compliance requires fixed historical records.
- You need a unified view for leadership
- Data should be viewed from a consistent lens
- Scheduling and emailing reports is required
-
-
Choose Dynamic If:
-
Different users need personalized views.
-
You want to reduce dashboard duplication.
-
Real-time role-based filtering is necessary.
- Users have different roles or territories
- You want to reduce dashboard duplication
- Each user should only see their own data
-
-
| Feature | Static Dashboard | Dynamic Dashboard |
|---|---|---|
| User View | One fixed perspective | Varies by logged-in user |
| Sharing | Based on folder access | Based on user permissions |
| Scheduling | Can be scheduled and emailed | Cannot be scheduled or emailed |
| Use Case | Executives, broad overview | Reps, managers needing personalized data |
Dynamic Dashboard Limits
Salesforce imposes limits on how many dynamic dashboards you can have:
-
- Enterprise Edition: 5 dynamic dashboards
- Unlimited and Performance Edition: 10 per org
- More can be purchased via Salesforce support
To view usage:
Go to Setup > Dashboards > Manage Dashboards and filter by “View Dashboard As: Logged-in User”
Governance and Security Considerations
-
- Folder Access: Dashboards are stored in folders—make sure folder permissions are well defined.
- Field-Level Security: Dynamic dashboards respect user profile access to fields and objects.
- Record-Level Security: Users only see records they have access to via Role Hierarchy, Sharing Rules, etc.
- Avoid Overuse: Use dynamic dashboards strategically to avoid hitting org limits.
Governance Best Practices for Dashboards in Salesforce
To ensure dashboards remain effective and secure, follow these governance guidelines:
A. Access Control & Security
-
-
Use Profiles & Permission Sets: Restrict dashboard access based on roles.
-
Leverage Dynamic Dashboards: Reduce duplication while maintaining data security.
-
Audit Sharing Settings: Ensure only authorized users can view sensitive data.
-
B. Performance Optimization
-
-
Limit Data Volume: Avoid overly complex queries that slow down dashboards.
-
Schedule Refreshes: For static dashboards, set periodic refreshes to keep data current.
-
Use Report Filters: Optimize underlying reports for faster loading.
-
C. Maintenance & Documentation
-
-
Version Control: Track changes if dashboards are modified frequently.
-
User Training: Educate teams on how to interpret dashboard data.
-
Deprecate Unused Dashboards: Archive or delete outdated dashboards to reduce clutter.
-
D. Compliance & Data Integrity
-
-
Static for Audits: Use static dashboards when historical accuracy is critical.
-
Dynamic for Real-Time Data: Ensure live dashboards reflect the latest permissions.
-
💡 Best Practices
-
- Use naming conventions to distinguish dynamic dashboards (e.g., “My Pipeline [Dynamic]”)
- Keep dashboards simple and focused to improve performance
- Use dashboard filters instead of cloning multiple versions
- Audit dashboards regularly for usage and relevancy
🧪 Real-World Scenario
Scenario: You manage a sales org with 20 reps and 3 regional managers.
-
- Without Dynamic Dashboards: You create 23 dashboards (one per user).
- With Dynamic Dashboards: You create 1 dashboard, and all users see relevant data based on their role and visibility.
This significantly reduces maintenance and ensures consistency.
Conclusion
Both static and dynamic dashboards have their place in Salesforce, depending on business needs. Static dashboards are great for standardized reporting, while dynamic dashboards offer flexibility and personalization. Proper governance ensures security, performance, and usability.
By understanding these differences and applying best practices, organizations can maximize the value of their Salesforce dashboards while maintaining data integrity and efficiency.
Reference Links
https://help.salesforce.com/s/articleView?id=analytics.dashboards_dynamic_overview.htm&type=5
https://help.salesforce.com/s/articleView?id=analytics.analytics_overview.htm&type=5
https://help.salesforce.com/s/articleView?id=000393271&type=1
https://www.apexhours.com/reports-dashboards/